Balance Sheet
The Balance Sheet shows what the company owns (assets), what it owes (liabilities) and what is left for the owners (equity) at the end of a chosen day. Run it at each month end to see cash, receivables, payables, retainage and the work-in-progress (WIP) position of your jobs, and to confirm that assets equal liabilities plus equity.
You can also lay several balance sheets side by side, one per month, quarter or year, to watch balances change.
Before You Begin
- The figures come from posted transactions. Post the period's bills, invoices, payments and WIP schedule before you rely on a month-end balance sheet.
- You need View or Edit access to Reports. See Who Can Use Reports.
Navigation
Reports → Balance Sheet.
Step by Step
- Open Reports → Balance Sheet. It opens as of today.
- In As Of, enter the date you want, for example 09/30/2026, or click a Quick dates button (Today, Last Month End, Last Fiscal Year End).
- To see one column per period, choose Months, Quarters or Years in Display Columns By and enter a From date (see Columns by Month, Quarter or Year).
- Click Run Report.
- Click an account code to open its General Ledger, or use Export CSV or Print (see The Report Frame).

- As Of: the day the balance sheet is drawn up. The report includes every transaction dated on or before it.
- Display Columns By: Total (one column, the default), Months, Quarters or Years.
- From: where the columns start. Needed only when Display Columns By is not Total.
Field Reference
| Field | Description | Required | Example |
|---|---|---|---|
| As Of | The balance sheet date. Opens as today. | Yes | 09/30/2026 |
| Display Columns By | Total shows one column. Months, Quarters and Years show one balance sheet per period, from From to As Of. Quarters and years follow your company's fiscal year. | No (Total) | Quarters |
| From | The first day covered by the columns. Must be on or before As Of. | With Months, Quarters or Years | 01/01/2026 |
| Quick dates | Today, Last Month End, Last Fiscal Year End. Each runs the report at once with one Total column. | No | Last Month End |
Reading the Balance Sheet
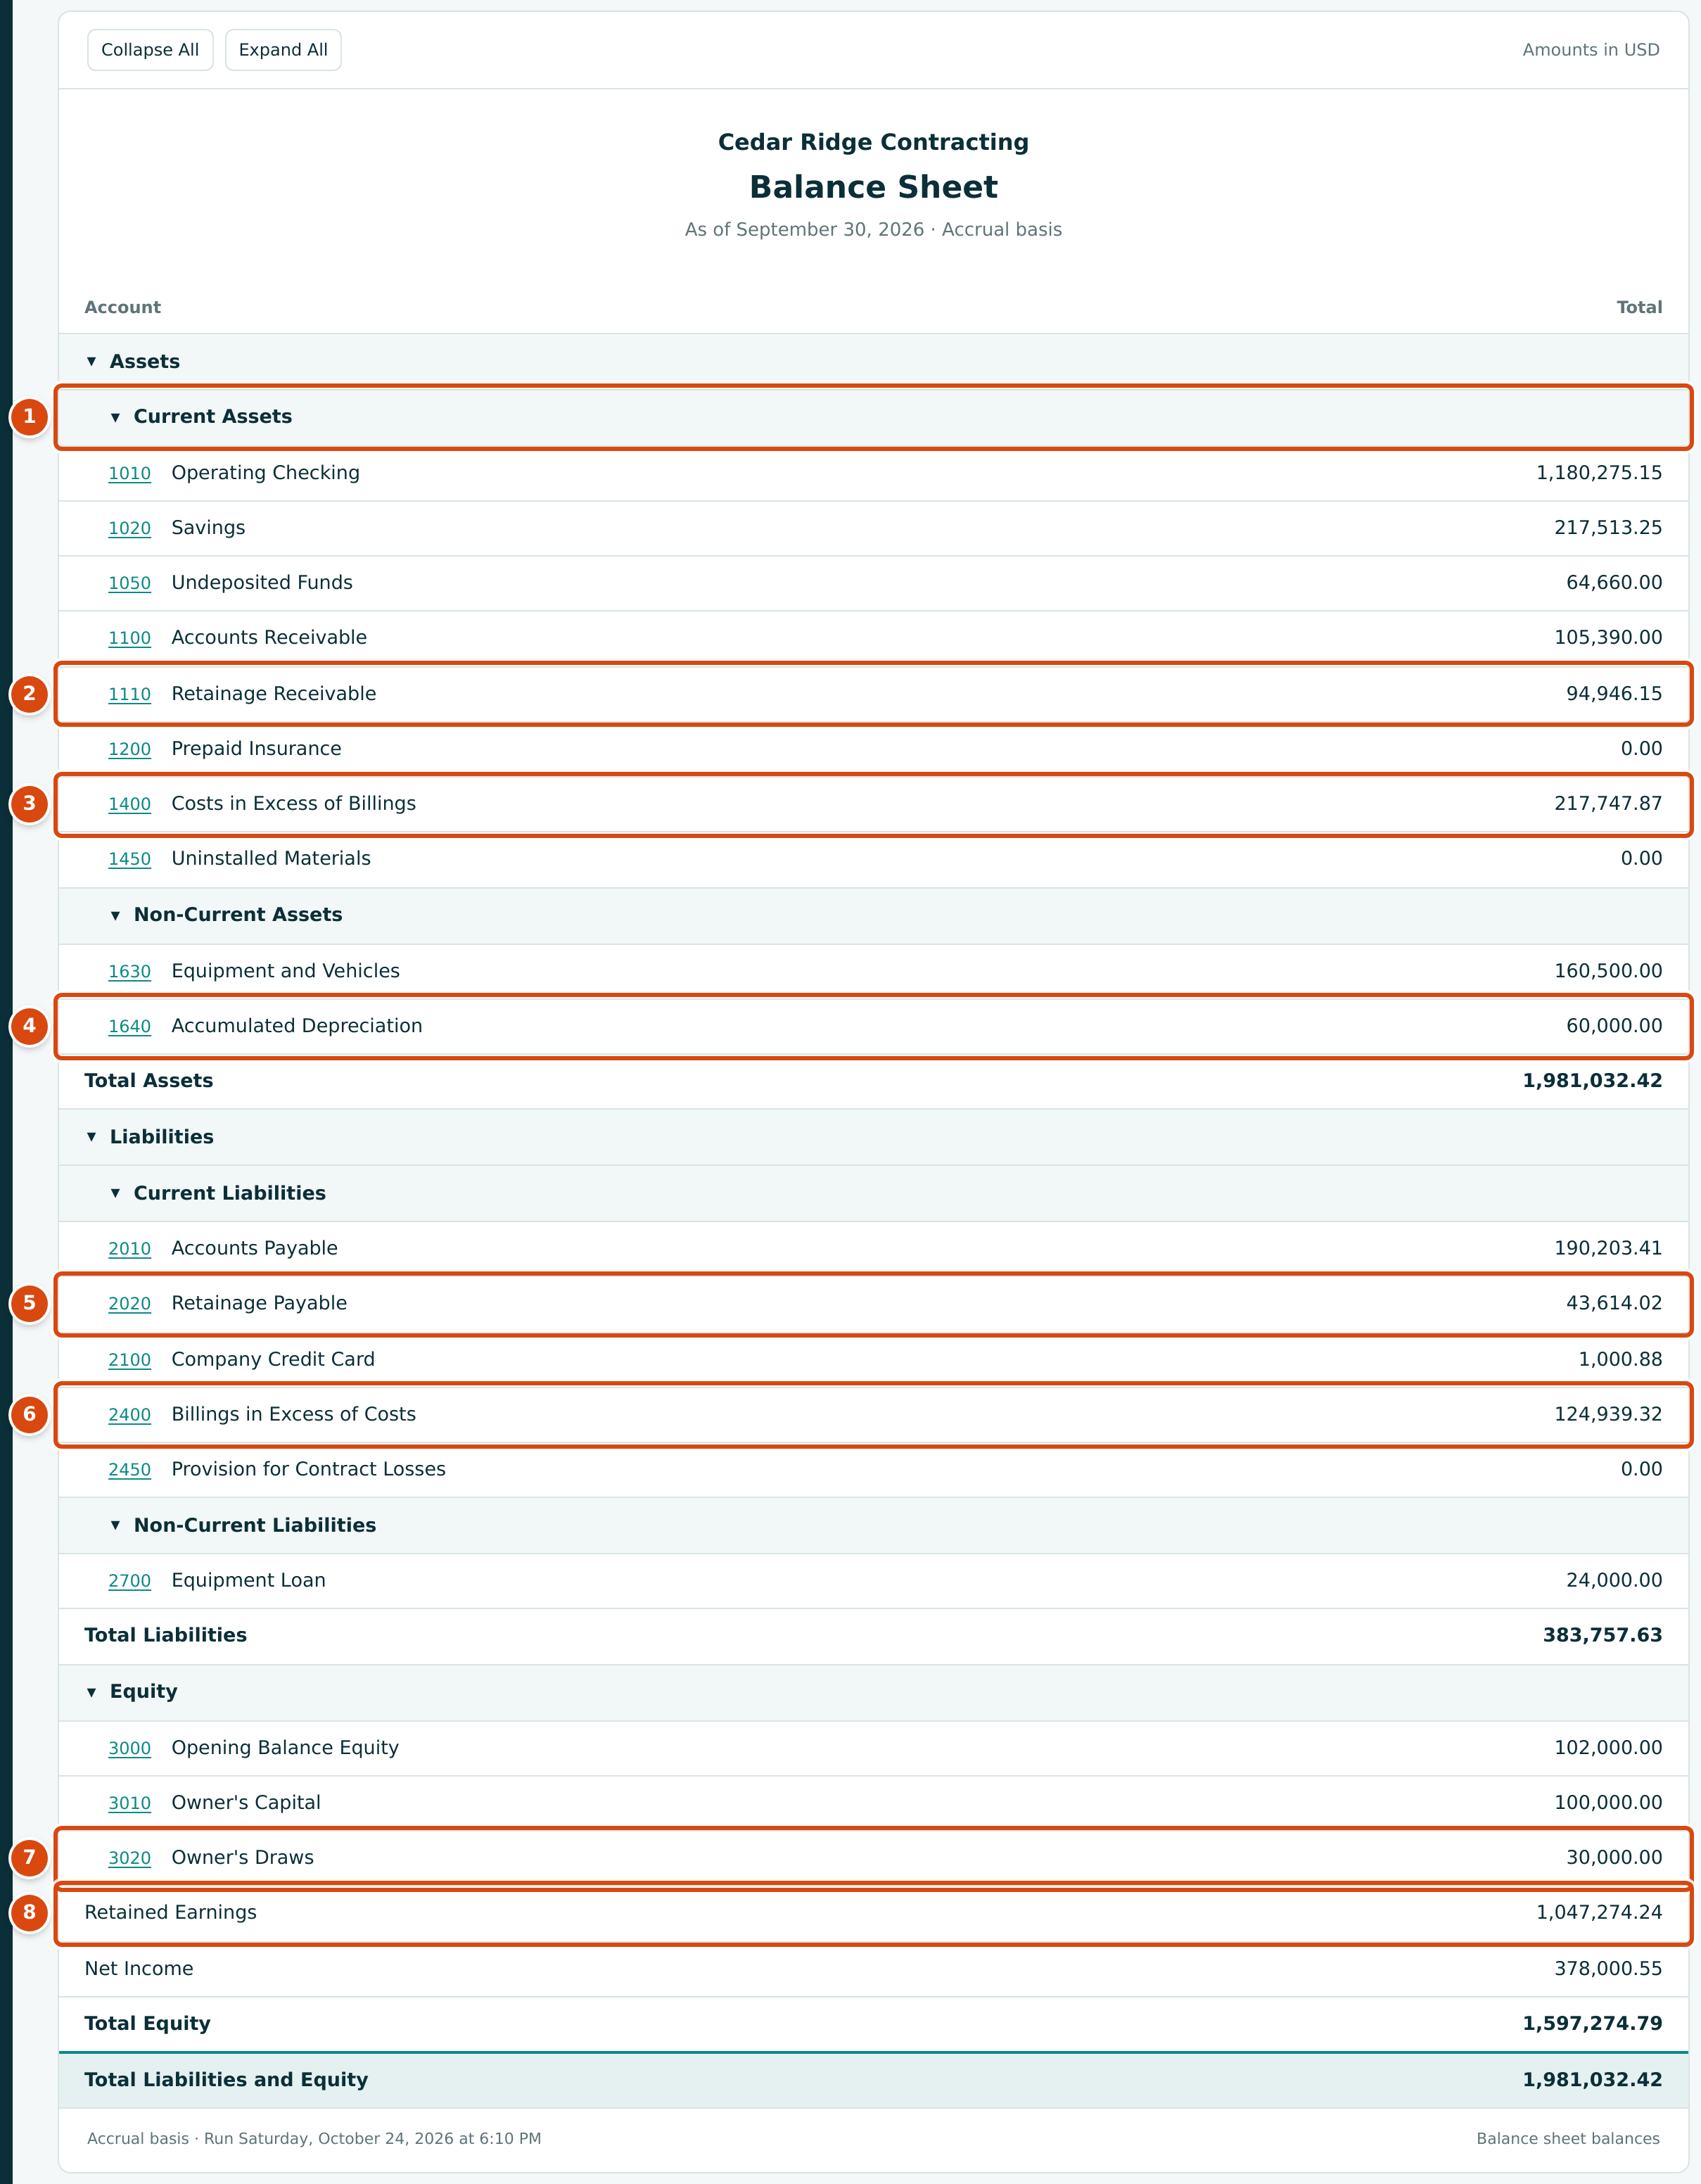
- Current Assets: cash, receivables, prepaid items and the WIP asset accounts. Each section can be folded with its ▼.
- 1110 Retainage Receivable: amounts your customers have held back from your invoices, collected later through a retainage release.
- 1400 Costs in Excess of Billings: the WIP asset. Jobs whose earned revenue is ahead of what you have billed (underbillings).
- 1640 Accumulated Depreciation: a contra account. It is shown as a positive 60,000.00 but is subtracted in Total Assets.
- 2020 Retainage Payable: amounts you have held back from your subcontractors' bills, paid later through a retainage release.
- 2400 Billings in Excess of Costs: the WIP liability. Jobs billed ahead of their earned revenue (overbillings).
- 3020 Owner's Draws: shown as a positive 30,000.00 but subtracted in Total Equity, because draws reduce equity.
- Retained Earnings and Net Income have no account code. Structally works them out from your income and expense accounts (see below).
Sections and Which Accounts Appear in Them
Each account appears in a section according to its role in the Chart of Accounts:
| Section | Account Roles |
|---|---|
| Current Assets | Cash, Receivable, Retainage Receivable, Inventory, Prepaid, Other Current Asset, Costs in Excess of Billings, Uninstalled Materials |
| Non-Current Assets | Equipment, Accumulated Depreciation, Property, Other Long Term Asset |
| Current Liabilities | Payable, Retainage Payable, Credit Card, Short Term Debt, Deferred Revenue, Tax Payable, Other Current Liability, Billings in Excess of Costs, Provision for Contract Losses |
| Non-Current Liabilities | Long Term Debt |
| Equity | Owner Equity, Owner Draws, Opening Balance Equity, then Retained Earnings and Net Income |
Accounts appear once they have any posted activity on or before the As Of date, even when their balance is 0.00 (in the sample, 1200 Prepaid Insurance and 1450 Uninstalled Materials). Accounts never used yet are left out.
Every amount is shown in the account's normal direction: debit balances for assets, credit balances for liabilities and equity. Accounts that work against their section, such as Accumulated Depreciation and Owner's Draws, show their own balance as a positive number and are subtracted in the section total. A negative amount means the account has gone the other way from normal (for example a bank account that is overdrawn).
The totals are Total Assets, Total Liabilities, Total Equity and Total Liabilities and Equity. The footer reads Balance sheet balances when Total Assets equals Total Liabilities and Equity, and Balance sheet is out of balance when it does not.
Retained Earnings and Net Income
Structally does not post year-end closing entries. Instead, the Balance Sheet works out two equity lines from your income, cost and expense accounts:
- Net Income: the profit from the start of the fiscal year that contains the As Of date through the As Of date. It equals the net income on the Profit and Loss for those dates.
- Retained Earnings: the profit of every earlier fiscal year, from the first transaction to the end of the previous fiscal year.
Your company's fiscal year is set when the company is created. In the sample company it is the calendar year.
Retainage and WIP Accounts
Construction balances appear as ordinary accounts in their sections:
| Account in the Sample Company | Section | What the Balance Means |
|---|---|---|
| 1110 Retainage Receivable | Current Assets | Retainage your customers still hold on posted invoices. See Retainage. |
| 1400 Costs in Excess of Billings | Current Assets | Underbillings from the latest posted WIP schedule. |
| 1450 Uninstalled Materials | Current Assets | Materials bought for jobs but not yet installed, deferred by a WIP schedule. |
| 2020 Retainage Payable | Current Liabilities | Retainage you still hold on posted subcontractor bills. |
| 2400 Billings in Excess of Costs | Current Liabilities | Overbillings from the latest posted WIP schedule. |
| 2450 Provision for Contract Losses | Current Liabilities | Losses expected on jobs, recognized by a WIP schedule. |
Accounts receivable and accounts payable exclude retainage: retained amounts sit in the retainage accounts until they are released.
Vendor Advances
When you have paid a vendor more than its open bills (an unapplied payment or credit), the Balance Sheet adds a Vendor Advances row at the end of Current Assets for the total paid ahead, and the Accounts Payable row says Includes … paid ahead, shown in Vendor Advances. Both Total Assets and Total Liabilities include the advance, so the balance sheet still balances. Click Vendor Advances to open the AP Aging for the same date, where the vendor shows a negative Unapplied amount. The sample company has no vendor advances on September 30, 2026.
Parent Accounts and Sub-Accounts
If your chart has sub-accounts, each parent account is a row with its own ▼. While it is open, the parent row shows only the amount posted directly to the parent, its sub-accounts follow, and a Total row (for example Total Equipment) adds them up. When you fold the parent, its row shows that total instead. Clicking the parent's code opens its own ledger; clicking the Total row opens the ledger with all of its sub-accounts. The sample company has no sub-accounts, so its balance sheet is a single level.
Columns by Month, Quarter or Year
Choose Months, Quarters or Years and a From date to see one balance sheet per period. Each column is the balance sheet at the end of its period; the last column is as of the As Of date itself, even when that date falls in the middle of a period. Quarters and years follow your fiscal year. The report is titled Balance Sheet by Month (or by Quarter, by Year).
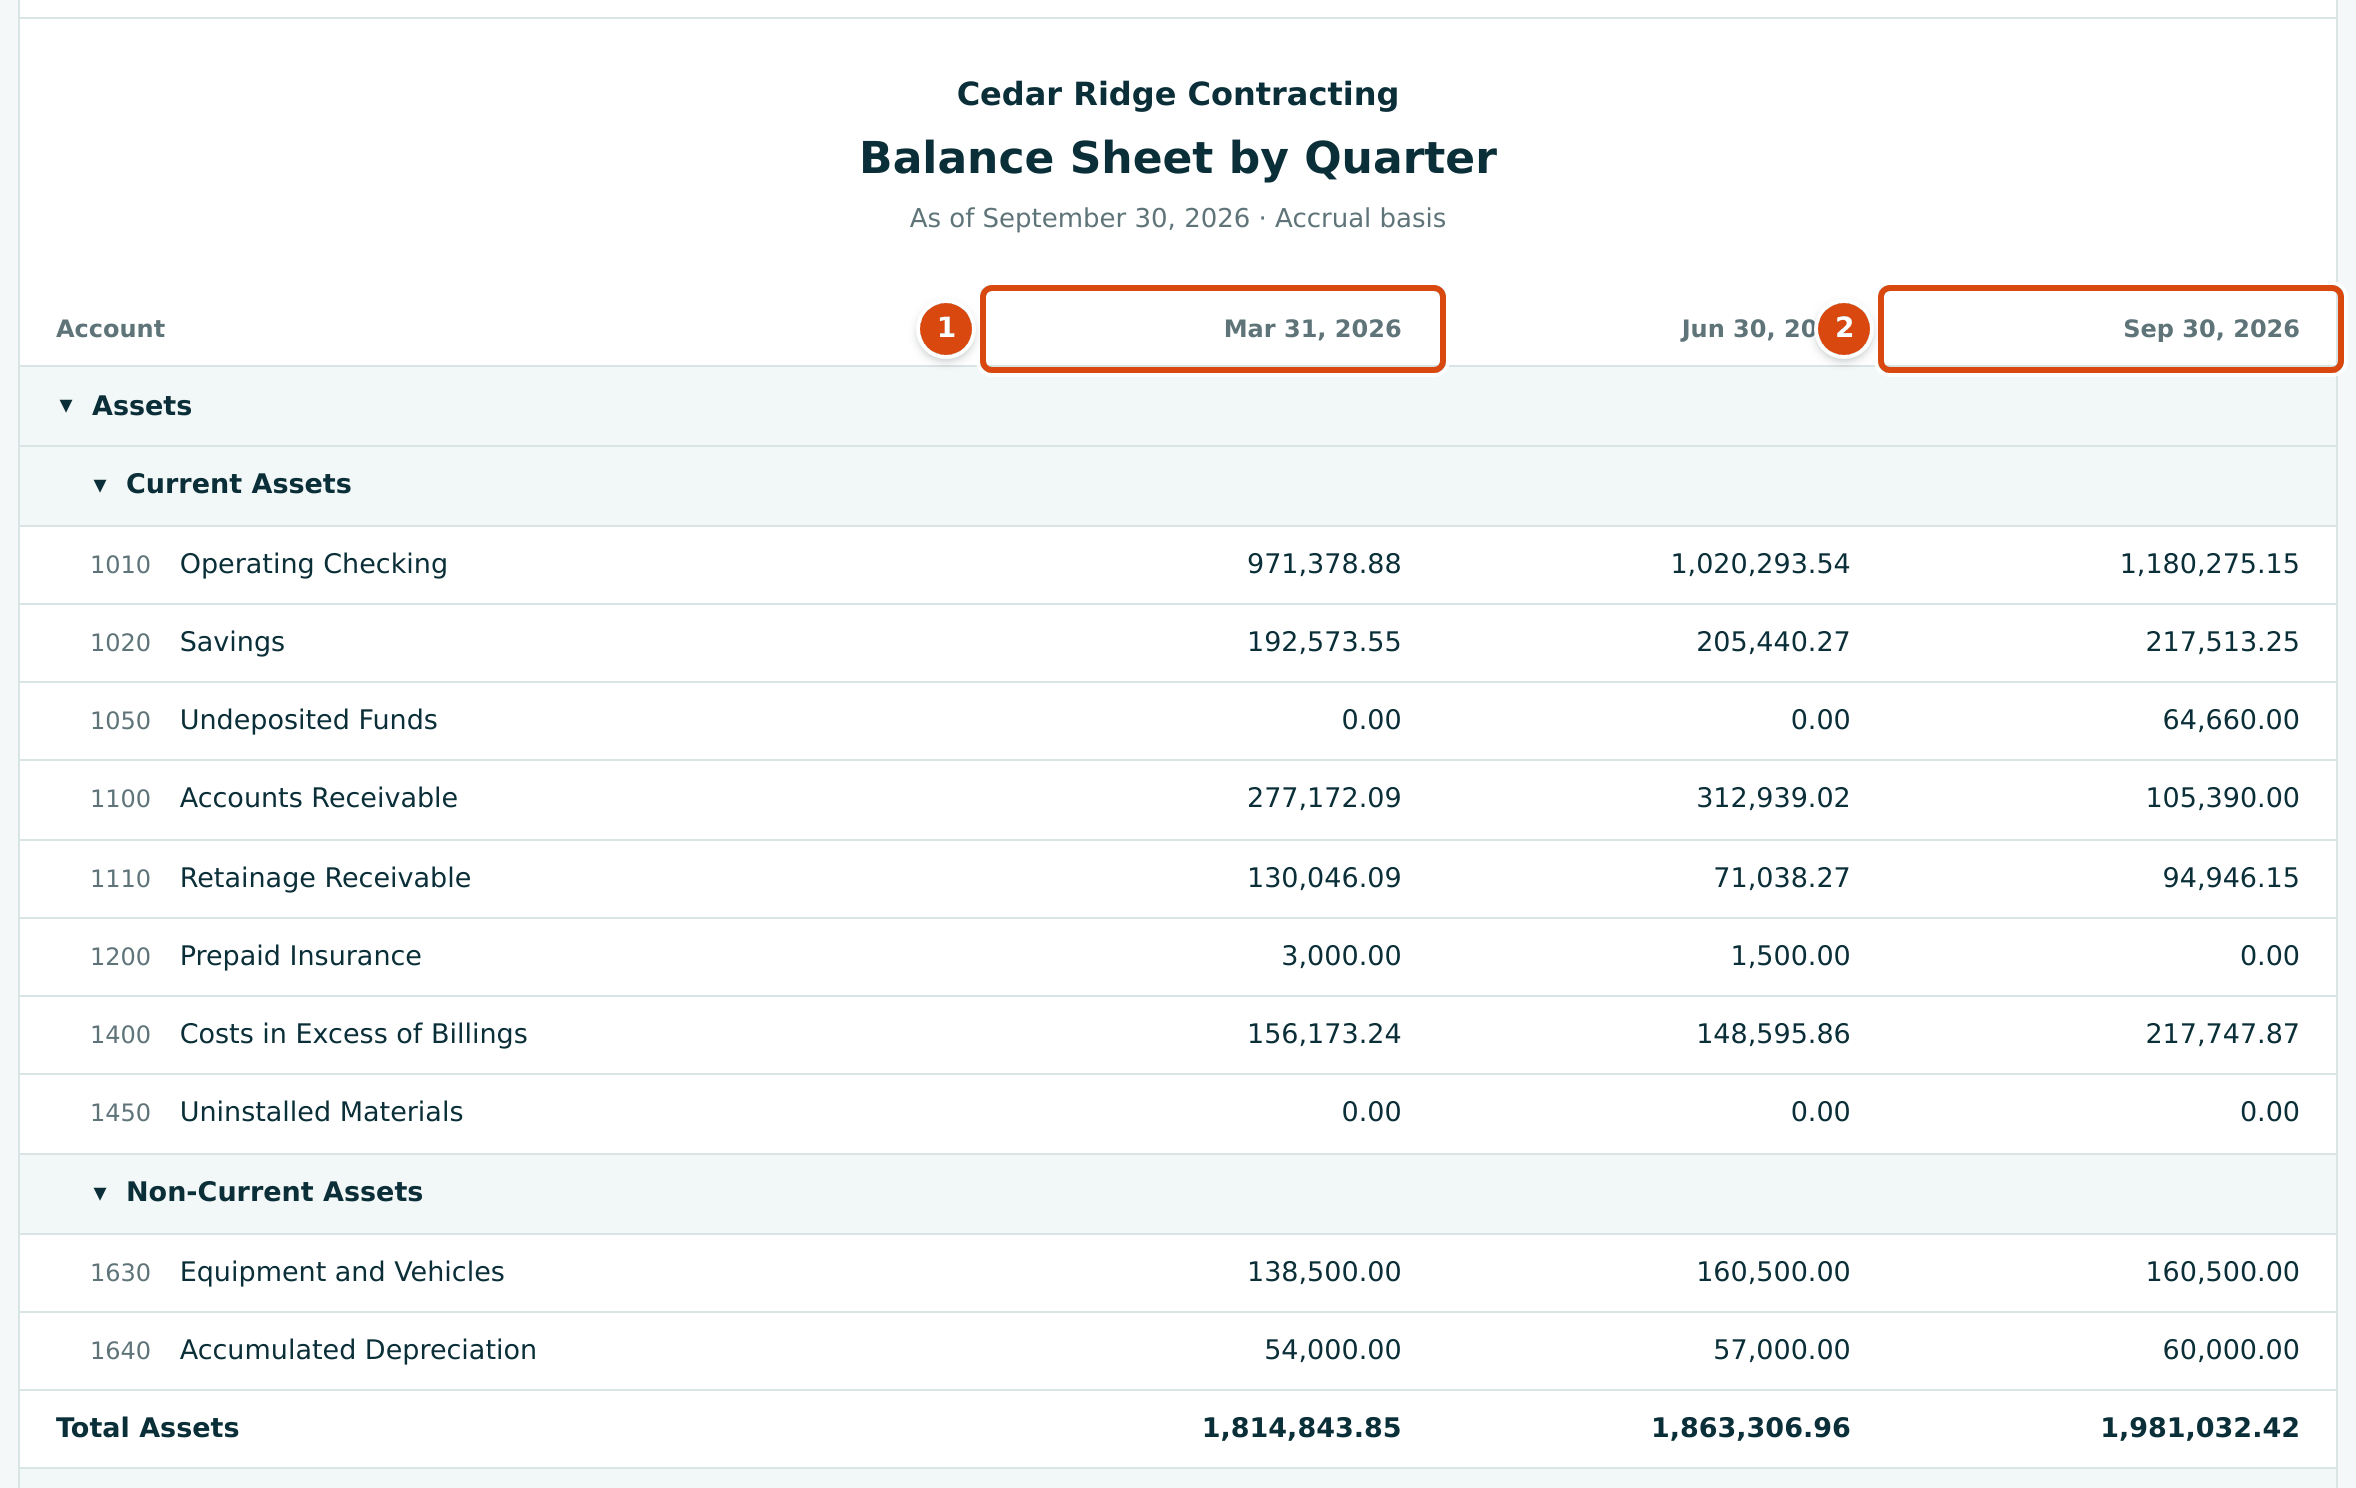
- The first column is the balance sheet at the end of the first quarter that From falls in.
- The last column is the balance sheet as of the As Of date.
- Column headings are the snapshot dates, such as Mar 31, 2026. With As Of September 15, 2026 and Months from July 10, the columns are Jul 31, 2026, Aug 31, 2026 and Sep 15, 2026.
- Account codes are not links when there is more than one column. Run a single Total column to drill down.
- Export CSV gives one amount column per snapshot date.
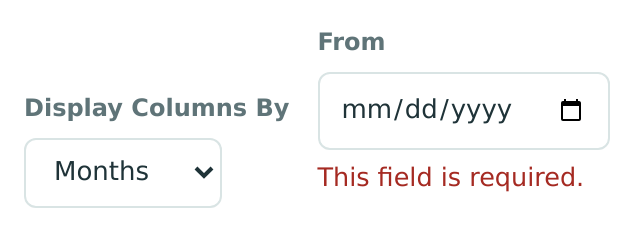
Columns need a From date. Without one, the report does not run and the field says so:
Worked Example: Cedar Ridge Contracting at September 30, 2026
Run the Balance Sheet as of 09/30/2026 (the figure in Reading the Balance Sheet).
| Line | Arithmetic | Amount |
|---|---|---|
| Current assets | 1,180,275.15 + 217,513.25 + 64,660.00 + 105,390.00 + 94,946.15 + 0.00 + 217,747.87 + 0.00 | $1,880,532.42 |
| Non-current assets | 160,500.00 − 60,000.00 accumulated depreciation | $100,500.00 |
| Total Assets | $1,981,032.42 | |
| Current liabilities | 190,203.41 + 43,614.02 + 1,000.88 + 124,939.32 + 0.00 | $359,757.63 |
| Non-current liabilities | 2700 Equipment Loan | $24,000.00 |
| Total Liabilities | $383,757.63 | |
| Equity accounts | 102,000.00 + 100,000.00 − 30,000.00 owner's draws | $172,000.00 |
| Retained Earnings | Profit of all fiscal years before 2026 | $1,047,274.24 |
| Net Income | Profit from January 1 to September 30, 2026 | $378,000.55 |
| Total Equity | $1,597,274.79 | |
| Total Liabilities and Equity | 383,757.63 + 1,597,274.79 | $1,981,032.42 |
What the figures tell you:
- Cash: the three cash accounts (1010, 1020 and 1050) hold $1,462,448.40, the Ending Cash on the Cash Flow for any period ending September 30, 2026.
- Retainage: customers hold $94,946.15 of Cedar Ridge's money (all of it on Summit Tech Park's job J-2004), while Cedar Ridge holds $43,614.02 of its subcontractors' money.
- WIP: underbillings of $217,747.87 less overbillings of $124,939.32 leave a net underbilling of $92,808.55. That is also the total credit on 4100 WIP Revenue Adjustment on the Trial Balance, because every WIP adjustment posts to both sides.
- Equity: Retained Earnings plus Net Income is $1,425,274.79, the profit since the books began; the Tie-Out check Net income agrees with equity compares exactly these figures.
Common Mistakes and Troubleshooting
| Message or Symptom | Why It Happens | What to Do |
|---|---|---|
| This field is required. under From | Display Columns By is Months, Quarters or Years, but From is empty. | Enter a From date, or set Display Columns By back to Total. |
| From must be on or before the as-of date. | From is later than As Of. | Choose an earlier From date. |
| Enter a valid date. | A date is incomplete or not a real date. | Pick the date from the calendar. |
| Choose a longer bucket or a shorter period | The columns would number more than 400. | Use Quarters or Years, or a later From date. |
| The footer says Balance sheet is out of balance. | Total Assets differs from Total Liabilities and Equity. | Run the Tie-Out for the same date to see which check fails. |
| Accumulated Depreciation or Owner's Draws looks like it adds to the total. | Contra accounts show their own balance as a positive number. | They are subtracted; see Sections and Which Accounts Appear in Them. |
| There is no Retained Earnings account to drill into. | Retained Earnings and Net Income are calculated, not posted. | Run the Profit and Loss for the fiscal year to see what makes up Net Income. |
| All figures are 0.00, or the report is empty. | The As Of date is before the company's first transaction (it opens as of today, which may be past your last entry). | Choose a date within the period you have recorded. |
| Codes are not underlined. | The report has more than one column. | Run it with Total to drill down. |
Related Topics
- Reports and The Report Frame
- Profit and Loss, which explains Net Income
- Cash Flow, which explains the change in cash
- Trial Balance and Tie-Out
- Retainage and WIP Schedules
- The Chart of Accounts