Cash Flow
The Cash Flow statement explains why the company's cash went up or down over a period. Profit and cash are not the same: a profitable month can still drain cash when customers pay slowly, when you pay down a loan, or when you buy equipment. The Cash Flow starts from net income and shows each of those differences, grouped into operating, investing and financing activities, until it arrives at the change in your cash accounts.
Before You Begin
- The figures come from posted transactions on the accrual basis.
- You need View or Edit access to Reports. See Who Can Use Reports.
Navigation
Reports → Cash Flow.
Step by Step
- Open Reports → Cash Flow. It opens for this month to date.
- Enter Start and End, for example 07/01/2026 and 09/30/2026, or click a Report period button (This Month, Last Month, This Fiscal Year, Last Fiscal Year).
- Click Run Report.
The Cash Flow has no other options: one Total column, always on the accrual basis.
Reading the Cash Flow
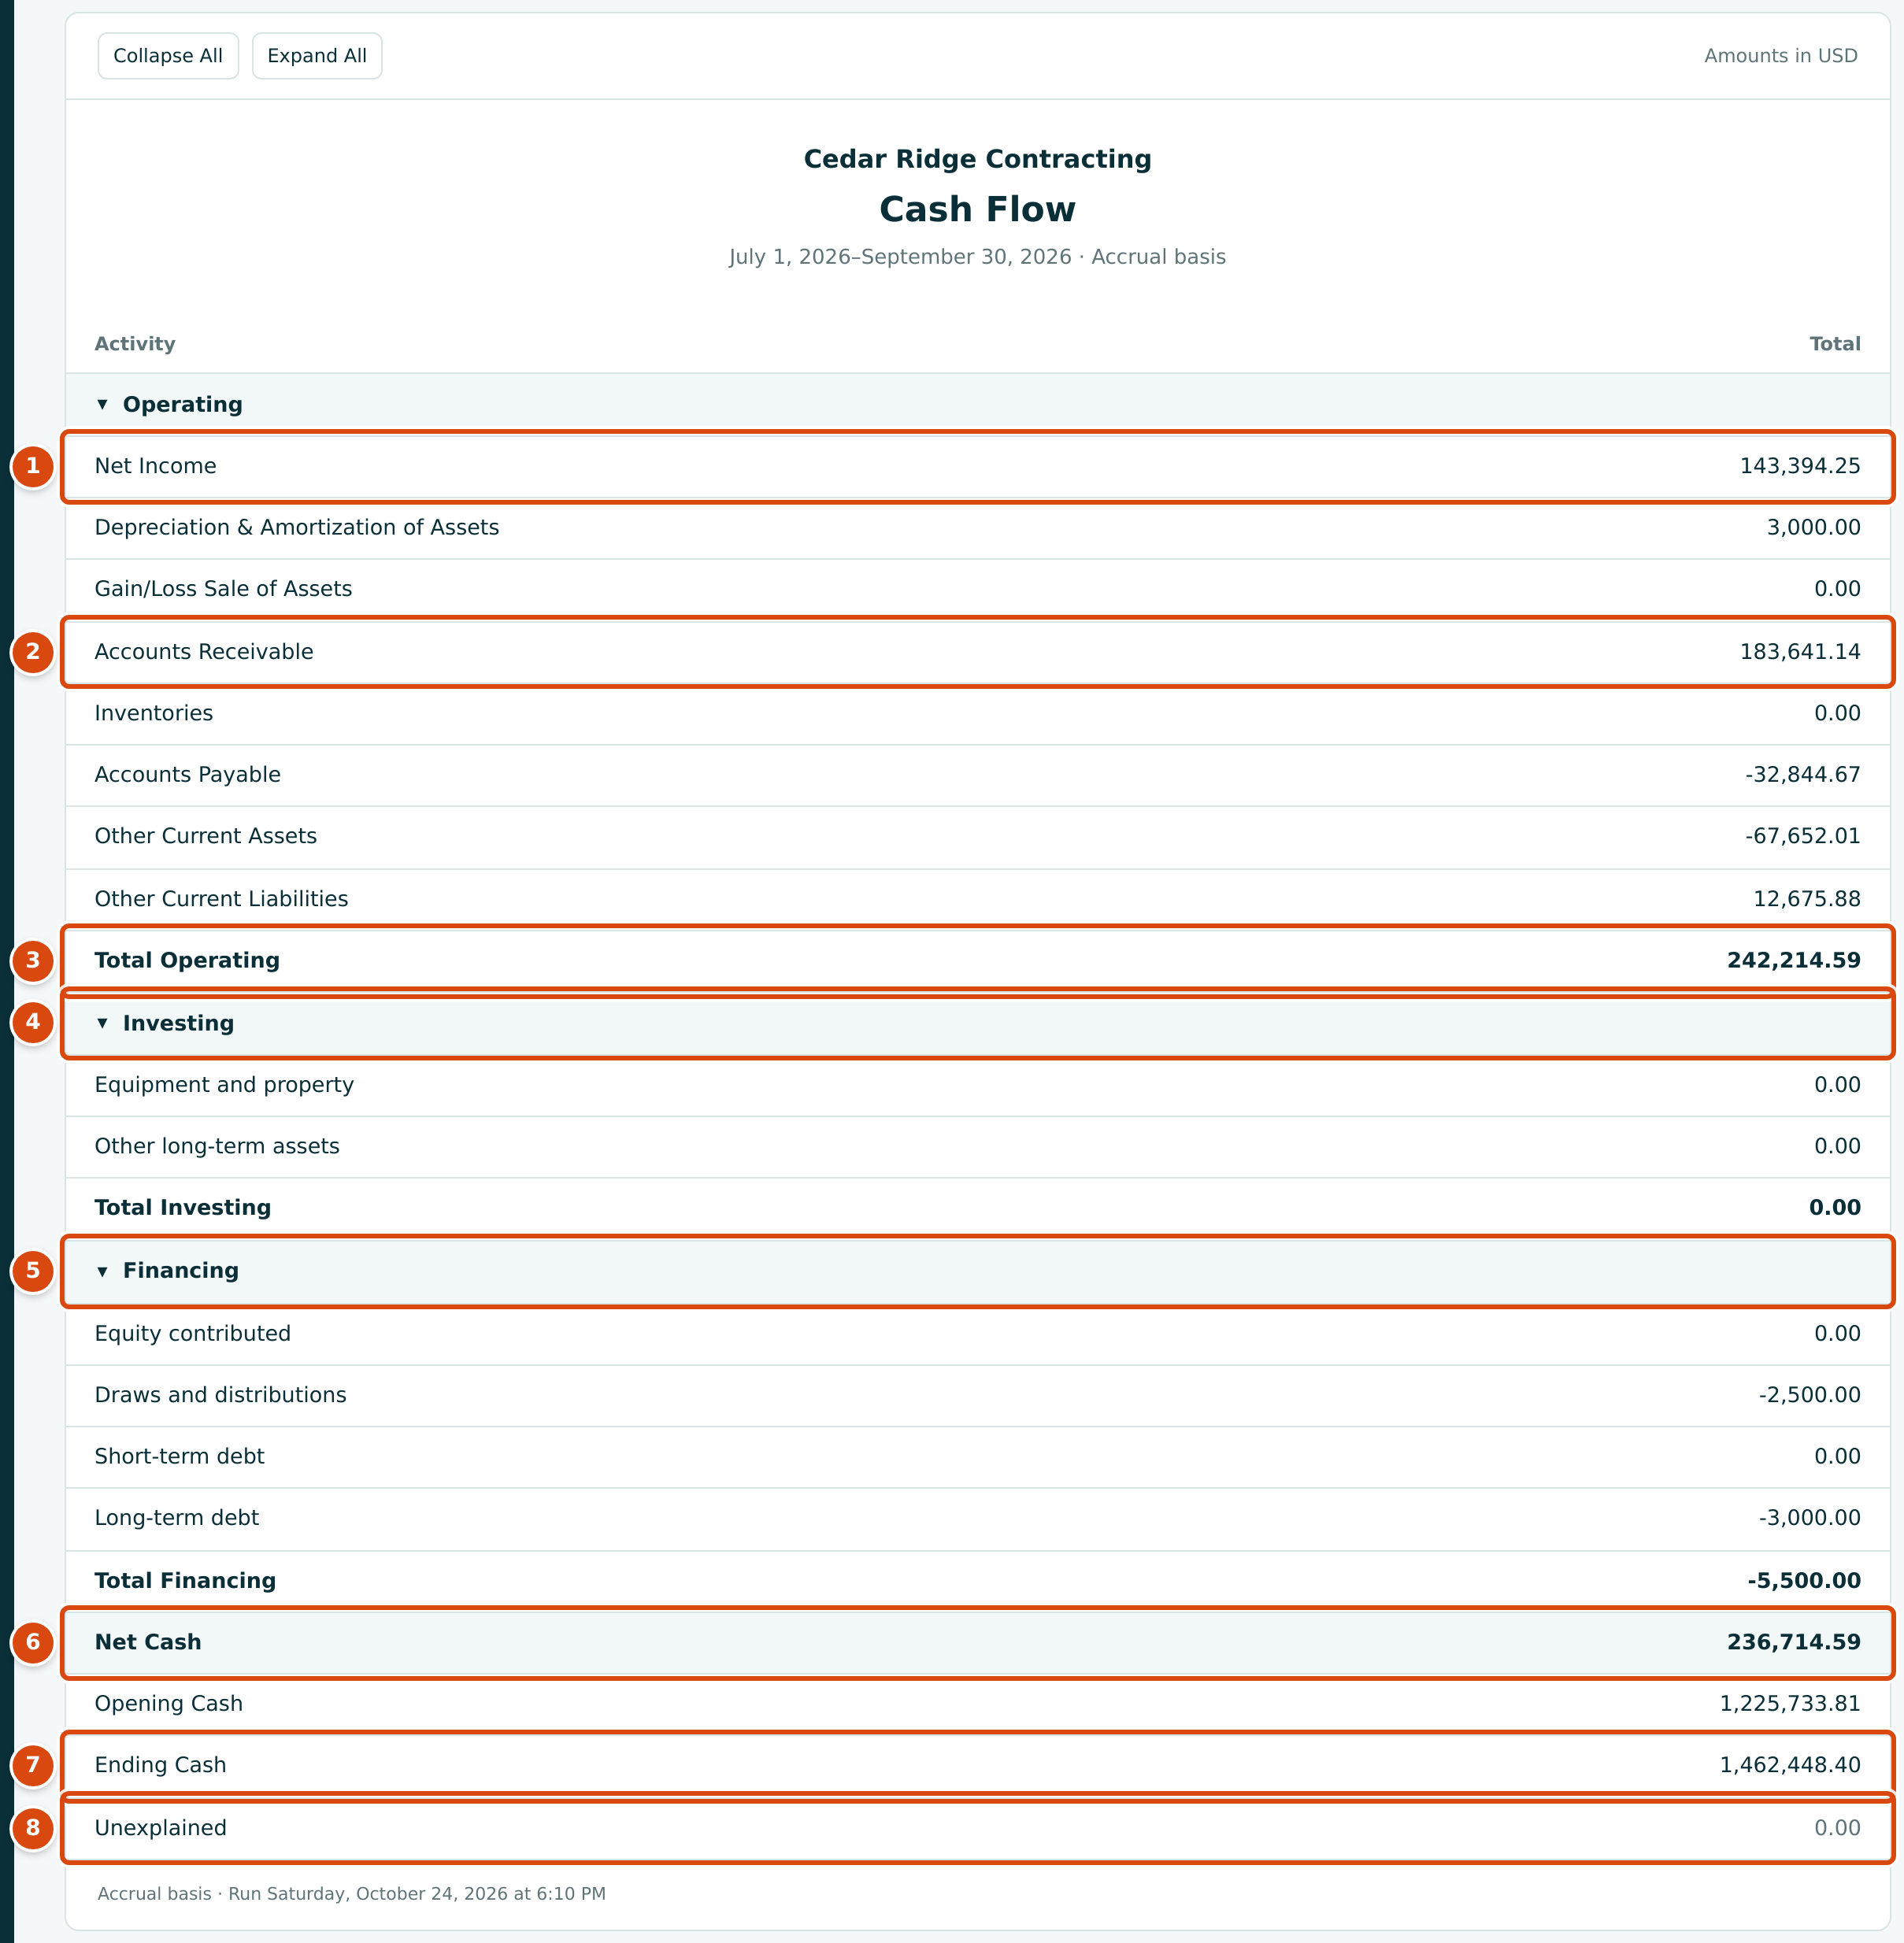
- Net Income: the same figure as the Profit and Loss for the period.
- The operating adjustments: how much of the profit is tied up in, or released from, receivables, payables and other working capital. A positive amount adds cash; a negative amount uses cash.
- Total Operating: cash from running the business.
- Investing: cash spent on (or received from) equipment, property and other long-term assets.
- Financing: cash from owners and lenders, less draws and loan repayments.
- Net Cash: Total Operating + Total Investing + Total Financing.
- Opening Cash and Ending Cash: the total of your cash accounts the day before Start and at End.
- Unexplained: Ending Cash − Opening Cash − Net Cash. It is 0.00 when the statement accounts for every change in your cash accounts.
How Structally Classifies Each Line
The statement works from the movement in each account over the period, classified by the account's role in the Chart of Accounts:
| Section | Line | Account Roles Behind It |
|---|---|---|
| Operating | Net Income | All income, cost and expense accounts |
| Operating | Depreciation & Amortization of Assets | Depreciation (added back, since it uses no cash) |
| Operating | Gain/Loss Sale of Assets | Gain Loss (removed, since the sale proceeds are investing) |
| Operating | Accounts Receivable | Receivable and Retainage Receivable |
| Operating | Inventories | Inventory |
| Operating | Accounts Payable | Payable, Credit Card and Retainage Payable |
| Operating | Other Current Assets | Prepaid, Other Current Asset, Costs in Excess of Billings, Uninstalled Materials |
| Operating | Other Current Liabilities | Deferred Revenue, Tax Payable, Other Current Liability, Billings in Excess of Costs, Provision for Contract Losses |
| Investing | Equipment and property | Equipment, Accumulated Depreciation and Property |
| Investing | Other long-term assets | Other Long Term Asset |
| Financing | Equity contributed | Owner Equity and Opening Balance Equity |
| Financing | Draws and distributions | Owner Draws |
| Financing | Short-term debt | Short Term Debt |
| Financing | Long-term debt | Long Term Debt |
Cash means the accounts with the Cash role: your bank accounts and Undeposited Funds (in the sample company 1010 Operating Checking, 1020 Savings and 1050 Undeposited Funds). A credit card account is not cash; its balance change appears in the Accounts Payable line. A transfer or deposit between two cash accounts does not change Net Cash at all.
Every line is shown even when it is 0.00, and the lines always appear in the order above.
Equipment Bought on Account
Equipment bought on a vendor bill counts as an investing outflow when the bill is paid, not when it is entered. When a payment covers a bill with both equipment and other lines, Pay Bills asks how much is for Equipment and Property (Investing) (see Paying Bills).
Two notes can appear under the statement, each folded until you click it:
- Non-Cash Investing and Financing Activities: "Transactions that changed what the company owns or owes without moving cash. They are not counted in the sections above." It lists equipment acquired on a bill (on the bill date) and entries that bought an asset with a loan, with links to each bill or entry.
- Note on Manual Journal Entries: equipment put on account by a manual journal entry instead of a bill. Structally shows it when it was recorded, not when it is paid, "because a manual journal does not say which later payment settles it". Record equipment bought on account as a vendor bill to have it shown when paid.
The sample company has neither note for 2026: its equipment purchase that year, the $22,000.00 mini excavator, was recorded by a journal entry on April 8, 2026 and appears in Equipment and property for any period that includes that day.
Tying the Cash Flow to the Balance Sheet
The Cash Flow and the Balance Sheet describe the same books:
- Run the Balance Sheet with Display Columns By Quarters (or Months) so that one column ends the day before your Cash Flow starts and another ends on its End date.
- Add up the cash accounts in each column. The first total is Opening Cash; the second is Ending Cash.
- Their difference is Net Cash, and Unexplained is 0.00.
- Each operating, investing and financing line is the change between the two columns in the accounts listed in the table above (with the sign turned around for assets: an increase in an asset uses cash).
The Tie-Out report runs this check for you: Cash flow explains the change in cash compares the change in cash since the books began with Net Cash for the same period.
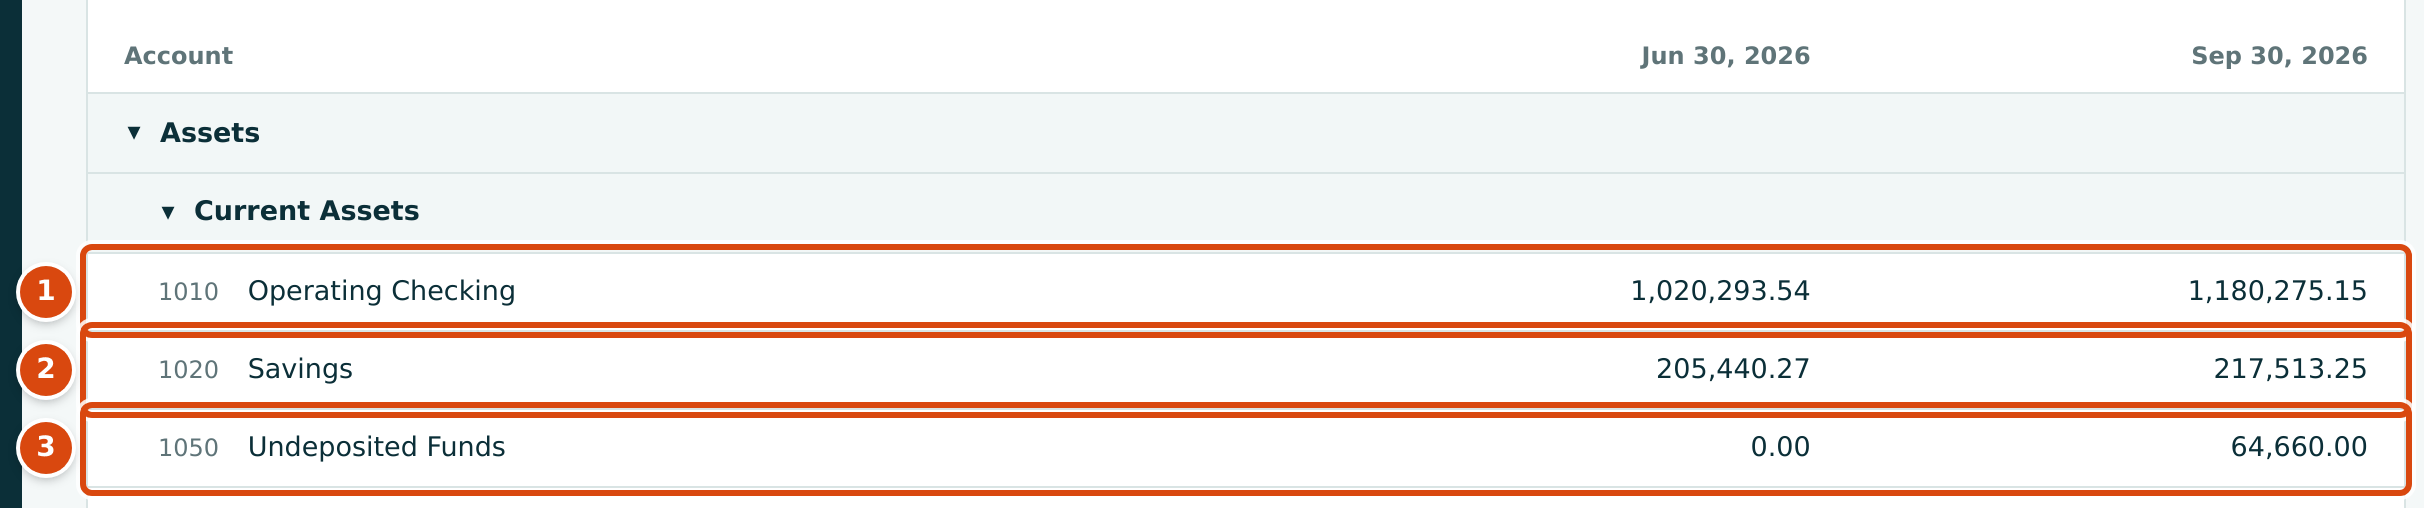
- 1010 Operating Checking: 1,020,293.54 and 1,180,275.15.
- 1020 Savings: 205,440.27 and 217,513.25.
- 1050 Undeposited Funds: 0.00 and 64,660.00.
Worked Example: The Third Quarter of 2026
Run the Cash Flow from 07/01/2026 to 09/30/2026, and the Balance Sheet by Quarters from 04/01/2026 to 09/30/2026 (columns Jun 30, 2026 and Sep 30, 2026).
Cash. Opening Cash is 1,020,293.54 + 205,440.27 + 0.00 = $1,225,733.81 and Ending Cash is 1,180,275.15 + 217,513.25 + 64,660.00 = $1,462,448.40, an increase of $236,714.59.
Where the increase came from. Each line is the change in its accounts between June 30 and September 30:
| Line | Balance Sheet Change | Amount |
|---|---|---|
| Net Income | Profit and Loss, July 1–September 30, 2026 | 143,394.25 |
| Depreciation & Amortization of Assets | 1640 Accumulated Depreciation, 57,000.00 → 60,000.00 | 3,000.00 |
| Accounts Receivable | 1100 + 1110: 312,939.02 + 71,038.27 = 383,977.29 → 105,390.00 + 94,946.15 = 200,336.15 (a decrease frees cash) | 183,641.14 |
| Accounts Payable | 2010 + 2100 + 2020: 247,560.81 + 912.02 + 19,190.15 = 267,662.98 → 190,203.41 + 1,000.88 + 43,614.02 = 234,818.31 (a decrease uses cash) | −32,844.67 |
| Other Current Assets | 1200 + 1400 + 1450: 1,500.00 + 148,595.86 + 0.00 = 150,095.86 → 0.00 + 217,747.87 + 0.00 = 217,747.87 (an increase uses cash) | −67,652.01 |
| Other Current Liabilities | 2400 + 2450: 112,263.44 → 124,939.32 | 12,675.88 |
| Total Operating | 242,214.59 | |
| Equipment and property | 1630 unchanged at 160,500.00; the depreciation is already added back | 0.00 |
| Draws and distributions | 3020 Owner's Draws, 27,500.00 → 30,000.00 | −2,500.00 |
| Long-term debt | 2700 Equipment Loan, 27,000.00 → 24,000.00 | −3,000.00 |
| Total Financing | −5,500.00 | |
| Net Cash | 242,214.59 + 0.00 − 5,500.00 | 236,714.59 |
Net Cash equals the increase in cash, so Unexplained is 0.00. The quarter's biggest source of cash, after its profit, was collecting receivables: accounts receivable and retainage receivable together fell by $183,641.14. Its biggest use was the growth in Costs in Excess of Billings, revenue earned on jobs but not yet billed.
Common Mistakes and Troubleshooting
| Message or Symptom | Why It Happens | What to Do |
|---|---|---|
| Start must be on or before end. | Start is after End. | Swap the dates. |
| Unexplained is not 0.00. | The sections do not account for the whole change in cash. | Run the Tie-Out for the End date and check Cash flow explains the change in cash. |
| Paying the credit card from checking shows in Operating. | Credit card accounts are not cash; the payment lowers the card balance in the Accounts Payable line. | Nothing to fix. |
| An equipment bill does not show in Investing. | Equipment bought on a bill counts when the bill is paid. | Look in Non-Cash Investing and Financing Activities, or run the period in which you paid it. |
| A transfer from checking to savings does not show anywhere. | Both accounts are cash, so Net Cash does not change. | Nothing to fix. |
| Net Income differs from the Profit and Loss. | The Profit and Loss is on the cash basis. | The Cash Flow uses the accrual net income; set the Profit and Loss to Accrual. |